Problem Set 12: Plotting functions
Submit this problem set to ps12 on Handin.
Note: Whenever you write a function in this class, follow the design recipe. You will be graded accordingly.
1 Warm-up
Problem 1.
Design a function celsius->fahrenheit which takes a temperature in Celsius and returns a number in Fahrenheit.
Design a function fahrenheit->celsius which takes a temperature in Fahrenheit and returns a number in Celsius.
Design a function fahrenheit->kelvin which takes a temperature in Fahrenheit and returns a number in Kelvin.
Abstract over celsius->fahrenheit, fahrenheit->celsius and fahrenheit->kelvin. In your new abstraction, all the inputs must be numbers; in other words, first revise the original functions so that the only differences that remain are numbers.
; convert : Number Number Number Number Number -> Number ; if a1 becomes b1 and a2 becomes b2, then what should a become?
;
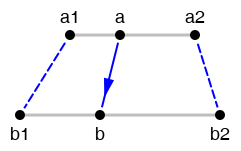
; *Assumption*: a1 and a2 are different (check-expect (convert 0 32 100 212 0) 32) (check-expect (convert 0 32 100 212 100) 212) (check-expect (convert 0 32 100 212 50) 122) (define (convert a1 b1 a2 b2 a) (/ (+ (* b1 (- a2 a)) (* b2 (- a a1))) (- a2 a1)))
(define (celsius->fahrenheit.convert c) (convert 0 32 100 212 c)) (define (fahrenheit->celsius.convert f) (convert ... ... ... ... f)) (define (fahrenheit->kelvin.convert f) (convert ... ... ... ... f))
Hint: To use convert, pay attention only to its signature, purpose and examples. You don’t need to look at its definition. If you’re not sure what convert does, study the three examples we provide above, and plug their inputs into the purpose statement we provide above. For example, (convert 0 32 100 212 50) answers this question: if 0 becomes 32 and 100 becomes 212, then what should 50 become? By plugging different inputs into the same purpose statement, you can complete these additional examples:
(check-expect (convert 0 100 10 110 7) ???) (check-expect (convert 0 0 10 2000 7) ???) (check-expect (convert 0 100 10 2100 7) ???)
2 Graph plotting
In the remainder of this problem set, you will develop a program that plots the graph of a function and lets the user move around and zoom in and out, like on a graphing calculator.
In this problem set, the word graph will refer to a list of Posns obtained from a given function f. The x field of each Posn will store an x-value. The y field of each Posn will store the value of f evaluated at the number stored in the x field. By drawing or plotting, we mean producing an image from the graph of a function.
The data contained in a graph will be interpreted as points in a Cartesian coordinate system. A big part of this problem set will be to relate lists of Posns interpreted in a Cartesian coordinate system to lists of Posns interpreted in the coordinate system of a DrRacket image. In this way, we will not just show a fixed image, but let the user move and zoom the view of the function.
; A World is (make-world Number Number Number Number) ; *Interpretation*: ; xmin is the Cartesian x coordinate of the left edge of the view ; xmax is the Cartesian x coordinate of the right edge of the view ; ymin is the Cartesian y coordinate of the BOTTOM edge of the view ; ymax is the Cartesian y coordinate of the TOP edge of the view (define-struct world [xmin xmax ymin ymax])
Problem 3. Define constants width and height which will be used to determine the width and height of the scene. Using build-list, define my-points to be a long list of Posns of your making.
(define my-plot (draw-lop my-points))
Problem 5. Design a function cartesian->image which takes a World and a list of Posns and returns a list of Posns. Use map and convert.
Do not return an image.
(check-expect (cartesian->image (make-world -2 2 -1 1) (list (make-posn 0 0) (make-posn 2 0) (make-posn -2 1))) (list (make-posn (/ width 2) (/ height 2)) (make-posn width (/ height 2)) (make-posn 0 0))) (check-expect (cartesian->image (make-world -2 6 0 1) (list (make-posn 0 0) (make-posn 2 0) (make-posn -2 1))) (list (make-posn (/ width 4) height) (make-posn (/ width 2) height) (make-posn 0 0)))
For this exercise and the rest of this problem set, you might find the following picture helpful, but don’t worry about it if it doesn’t make sense to you.

Problem 6. Design a function navigate to be used as a big-bang key-event handler. Thus, navigate takes a World and a key event and returns a World. navigate enables 8 distinct keyboard-driven behaviors (aside from nothing at all).
The arrow keys will allow the user to move in four different directions in the scene. For example, the "down" key should subtract the same amount from both ymin and ymax. That amount should be something proportional to (- ymax ymin), such as (* speed (- ymax ymin)). Define the constant speed to be a number between 0.1 and 0.4, such as 0.2.
The keys w, a, s and d will allow the user to zoom in four ways: the w key will zoom in just with respect to the y-axis and the s key will do the opposite; the d key will zoom in just with respect to the x-axis and the a key will do the opposite. For example, the "w" key should add an amount to ymin and subtract the same amount from ymax. That amount should again be something proportional to (- ymax ymin), such as (* speed (- ymax ymin)).
Problem 8. Design a function xticks which takes three numbers xmin, xmax and n and produces an evenly spaced list of n numbers from xmin to xmax. The output list will be interpreted as x-values in the Cartesian coordinate system. Assume that xmin and xmax are different.
(xticks -2 2 (add1 width))
Use build-list and convert.
Problem 10. Design a function draw-graph which takes a World and a function Number -> Number and produces its plot. draw-graph should be the composite of draw-lop, cartesian->image, graph and xticks. Pass (add1 width) to xticks as the number of ticks to generate.
3 Extra credit
(This challenge problem is not required.)
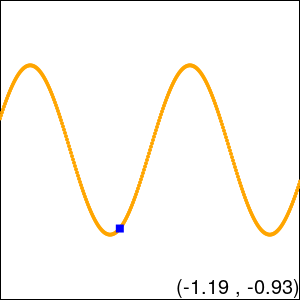
Problem 12. Let’s give the user the ability to select a point in the graph of a function with the mouse and to see its coordinates. Specifically, when the user clicks on the plot with the mouse, a mark should appear corresponding to the point of the graph closest to location of the mouse event. Moreover, the program should display the Cartesian coordinates of the mark:
Here are a few suggestions. Extend the data definition of World to include a number representing the x-coordinate of the current mark (if there exists one) in Cartesian coordinates. This extra number will be updated on the mouse event “button-down”. The mouse-handler will therefore determine (via helpers) which point in the current graph is closest and extract its x-coordinate. Note that this means that the mouse-handler should be aware of the function being plotted: so just as draw-graph is parametrized by the function to be plotted, your mouse-handler should also be parametrized by the function to be plotted.
The coordinates should display as inexact numbers rounded to the nearest hundredth: exact->inexact, round, * and / are useful in achieving this.